


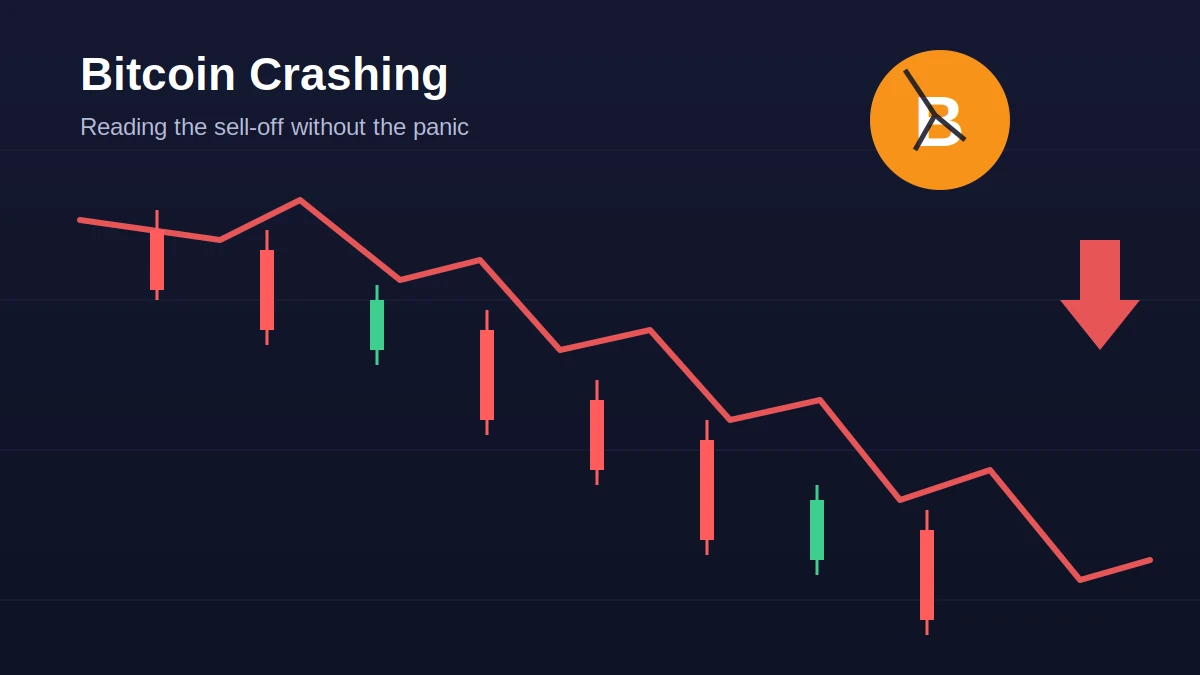
Bitcoin is crashing again, and if you’ve refreshed your portfolio app three times in the last hour, you’re not alone. The chart is red, the group chats are panicking, and somewhere a cousin is telling you he called this months ago. Here’s the thing though: bitcoin crashing isn’t a new phenomenon, it’s practically a seasonal event at this point. What matters is understanding why it’s happening this time, how bad it could get, and what you actually do about it instead of just staring at candles turning redder by the hour.
This isn’t a hype piece and it isn’t a doom piece either. It’s a straight breakdown of what’s driving Bitcoin’s fall, how this crash stacks up against previous ones, and the kind of thinking that separates investors who survive a downturn from the ones who get shaken out right before the bottom.
Why Is Bitcoin Crashing Right Now?
There’s rarely one single reason Bitcoin drops hard, and this crash is no exception. What’s happening is a pile-up of separate pressures hitting at roughly the same time, each one making the others worse. Strip away the noise and three forces stand out.
The ETF Outflow Problem
Spot Bitcoin ETFs were supposed to be the steady hand of this market cycle, a reliable channel for institutional money to flow in. For a while, that’s exactly what they were. Then the flow reversed. Billions of dollars have exited these funds in recent weeks, with the largest funds seeing the heaviest redemptions. When ETF demand disappears, the market loses its most consistent buyer, and every dollar that leaves has to be absorbed by someone else willing to catch the falling knife.
This matters more than a single bad headline because ETF flows aren’t emotional, they’re mechanical. Big allocators rebalancing a portfolio don’t care about sentiment, they care about risk models and mandates. When those models say reduce exposure, the selling doesn’t stop just because the price looks cheap.
Read More :Government Shutdown Polymarket Odds: What They Show
A Major Corporate Holder Started Selling
For years, the biggest corporate Bitcoin holder was known for one thing: buying, never selling. That changed. Confirmation of a large Bitcoin sale by the company, used to cover dividend obligations on its preferred stock, rattled a market that had priced in permanent accumulation from this player. It wasn’t the size of the sale that spooked traders as much as the precedent. If the biggest ‘diamond hands’ holder in the market can become a seller, the psychological floor everyone assumed was there starts to look a lot less solid.
Macro Pressure: Rates, the Dollar, and Geopolitics
Bitcoin doesn’t trade in a vacuum. A Federal Reserve reluctant to cut rates, a stronger dollar, and geopolitical tension have all pulled liquidity away from risk assets generally, and crypto tends to get hit first and hardest when that happens. Add in a market structure bill stuck in political limbo and you’ve got a cocktail of uncertainty that gives investors every reason to sit on the sidelines rather than buy the dip.
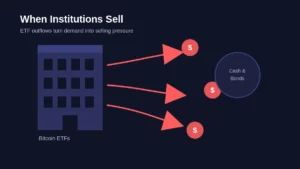
Institutional selling through ETFs has turned a demand driver into a source of downward pressure.
How Far Has Bitcoin Actually Fallen?
Numbers help cut through the panic. Bitcoin’s all-time high sat above $126,000 late last year. Since then, it has shed more than half its value, sliding into the high $50,000s to low $60,000s range depending on the day you check. That’s a serious drawdown by any measure, but it’s worth putting in context: Bitcoin has now had multiple corrections north of 50% throughout its history and has recovered from every single one so far. That track record doesn’t guarantee anything about this cycle, but it does mean a deep drawdown alone isn’t proof the asset is finished.
The move below the $60,000 psychological level matters because that number had become more than just a round figure. It was the line watched by leveraged traders, ETF buyers, and long-term holders alike. Once it broke, selling accelerated as stop-losses triggered and the market went hunting for the next support zone.
Bitcoin Crash History: How This One Compares
If you’ve been in crypto since 2021 or earlier, this chart probably feels familiar in an uncomfortable way. Bitcoin fell over 75% during the 2022 bear market following the Terra and FTX collapses. It dropped more than 80% after the 2017 peak. Compared to those, the current decline of just over 50% is severe but not unprecedented.
What’s genuinely different this time is who’s doing the selling. Previous crashes were largely retail-driven, amplified by over-leveraged traders getting liquidated in panic. This one has institutional fingerprints all over it: ETF redemptions, basis trade unwinds, and corporate treasury rebalancing. Retail panic is following the institutional selling, not leading it. Whether that makes the bottom easier or harder to call is genuinely debated among analysts, and anyone claiming certainty either way is selling you something.
Key Support Levels Traders Are Watching
Technical levels don’t predict the future, but they do tell you where buyers and sellers have historically shown up in size, which makes them useful markers rather than magic numbers.
$58,000 to $57,500: The immediate zone where dip buyers have stepped in during recent sessions.
$55,000: A level tied to prior consolidation, watched closely if the lower zone fails to hold.
$49,000 to $50,000: Matches lows from prior cycles and would represent a much deeper capitulation event if tested.
On the upside, reclaiming and holding above $62,000 to $63,000 would be the first real sign that sellers are losing control, especially if it comes alongside a return of positive ETF inflows.
Is This the End of the Bull Market, or Just a Brutal Correction?
Honestly, nobody can answer this with certainty, and you should be skeptical of anyone who claims otherwise. What we can say is that the fundamentals separating this cycle from a true structural collapse are still intact. No major exchange has failed. No large stablecoin has depegged. The underlying Bitcoin network is running exactly as designed, block after block, completely unaffected by the price action on exchanges.
That distinction matters. A crash driven by fundamental failure, like the Terra or FTX collapses, tends to take much longer to recover from because trust itself has to be rebuilt. A crash driven by macro pressure and institutional deleveraging, which is closer to what’s happening now, tends to resolve faster once the underlying pressure (rates, dollar strength, regulatory uncertainty) eases up.
The hardest part of a crash isn’t the price, it’s keeping a clear head while everyone around you loses theirs.
What Should You Do When Bitcoin Is Crashing?
This is where most articles either tell you to buy everything or sell everything. Neither is honest advice because it depends entirely on your own situation, risk tolerance, and time horizon. What follows isn’t investment advice, it’s the kind of thinking that tends to separate calm decision-making from panic decision-making.
Don’t Let Headlines Make Your Decisions
Headlines are optimized for clicks, not accuracy. A 2% daily move gets framed as a catastrophe because fear generates more engagement than calm analysis. Before reacting to any single headline about Bitcoin crashing, check the actual price action and support levels yourself rather than reacting to a scary title.
Dollar-Cost Averaging Through a Downturn
For investors with a long time horizon, spreading purchases out over weeks or months during a downturn, rather than trying to time the exact bottom, has historically smoothed out entry prices. Nobody consistently catches the bottom, not even professional traders with years of experience. Trying to guess it exactly is a good way to end up on the sidelines the entire time prices are actually cheap.
Red Flags to Watch Before Buying Any Dip
Not every dip is a buying opportunity, and pretending otherwise is how people end up holding assets that never recover. Before treating a crash as an entry point, check whether the selling is driven by a structural problem (an exchange failure, a stablecoin depeg, a project running out of funds) versus macro pressure and sentiment. The former is a much bigger warning sign than the latter. Also watch leverage in the system: extremely high open interest in futures markets ahead of a crash tends to mean more liquidations are coming before things stabilize.
Bitcoin Crashing: Frequently Asked Questions
Why is Bitcoin crashing today?
Bitcoin is crashing due to a combination of heavy spot ETF outflows, a large Bitcoin sale from a major corporate holder, and macro pressure from a hawkish Federal Reserve and geopolitical uncertainty. These factors combined to push BTC below the closely watched $60,000 support level.
How low can Bitcoin drop in this crash?
Analysts watching current support zones point to $55,000 as the next major level if $58,000 fails to hold, with a deeper capitulation scenario near $49,000 to $50,000 if selling pressure continues. These are technical levels, not guarantees, and price action can diverge from any prediction.
Is it a good time to buy Bitcoin during a crash?
Whether it’s a good time depends on your personal risk tolerance and time horizon, not a universal answer. Long-term investors often use downturns to average into a position gradually rather than trying to time the exact bottom, while short-term traders face significantly higher risk from continued volatility.
How does this crash compare to previous Bitcoin crashes?
The current decline of roughly 50% from all-time highs is severe but smaller than the 2022 crash (over 75%) and the 2018 crash (over 80%). A key difference this time is that selling has been driven mainly by institutional ETF outflows and corporate rebalancing rather than an exchange collapse or fraud.
Will Bitcoin recover from this crash?
Bitcoin has recovered from every major drawdown in its history so far, though past performance doesn’t guarantee future results. Recovery typically depends on ETF flows turning positive again, easing macro pressure from the Federal Reserve, and renewed institutional confidence.
The Bottom Line on Bitcoin Crashing
Bitcoin crashing isn’t the end of the story, it’s a chapter that’s happened before and will likely happen again. What separates this decline from prior ones is who’s selling and why, and that’s worth paying attention to more than the raw percentage drop. If you want to track how this situation develops alongside other market-moving events, keep an eye on our market coverage on the Crytix10 homepage for ongoing updates as new articles go live.
For a deeper technical background on how Bitcoin works as a network, Wikipedia’s Bitcoin entry is a solid, neutral starting point.