


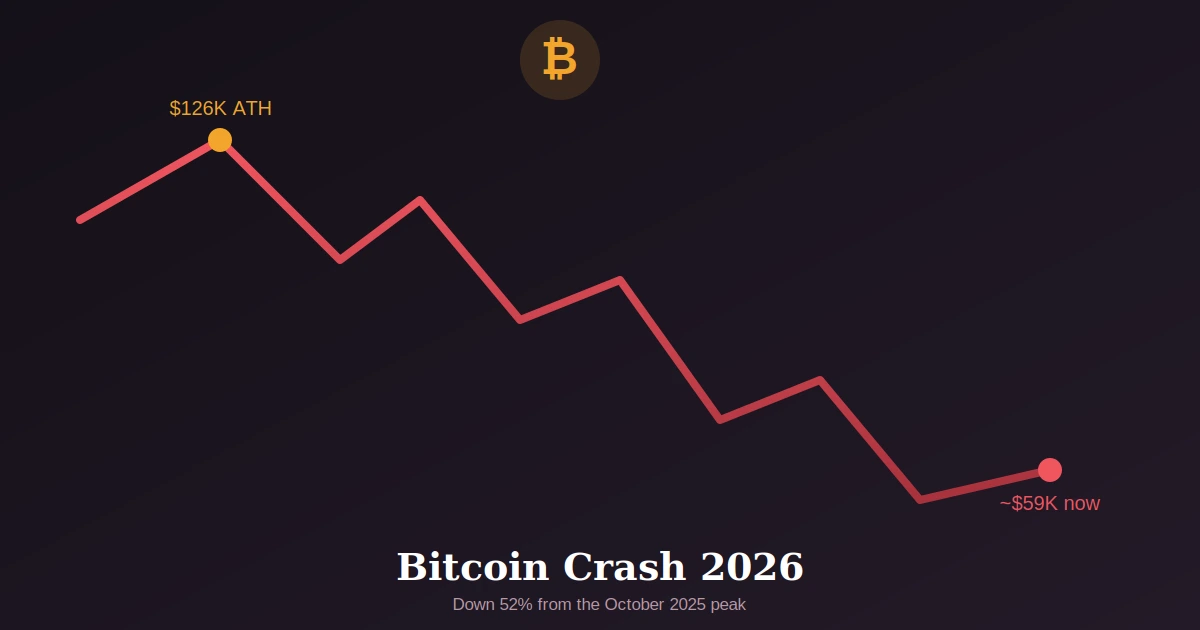
Nine months ago Bitcoin hit $126,210 and every headline was about six-figure targets and a supposed new era of institutional adoption. Now it’s sitting under $60,000, down more than half, and the same commentators are debating whether the bull market is dead. Both moments were real. Neither one tells the whole story on its own. Here’s what actually happened between those two points, laid out plainly, without the daily-news whiplash most coverage buries it under.
Bitcoin Crash 2026, the Short Answer
Bitcoin’s 2026 crash is being driven by five things converging at once, a hawkish Federal Reserve that killed rate-cut hopes after Trump’s tariff announcement reignited inflation fears, an unresolved US-Iran conflict pushing oil and inflation expectations higher, Bitcoin ETFs flipping from a reliable source of buying pressure into a source of selling pressure, Strategy’s symbolically massive first-ever Bitcoin sale, and revived fears over Mt. Gox’s looming creditor repayments. None of these is a crypto-specific failure, no exchange collapsed and no stablecoin broke, which is actually the most important thing to understand about this particular crash.
How Bad Is This Bitcoin Crash, By the Numbers
Here’s where things actually stand as of early July 2026.
| Metric | Where things stand (early July 2026) |
| All-time high | $126,210, reached October 6, 2025 |
| Current price | Roughly $58,000 to $60,000 |
| Drawdown from ATH | About 52 to 53% |
| June 2026 ETF flows | Roughly $4.5 billion in net outflows |
| Fear and Greed Index | 11, Extreme Fear |
| Key support levels | $58,000, then $55,000, then $50,000-52,000 |
| Comparable 2022 drawdown | 77 to 85% peak-to-trough, for context |
The Timeline, How the Bitcoin Crash Actually Unfolded
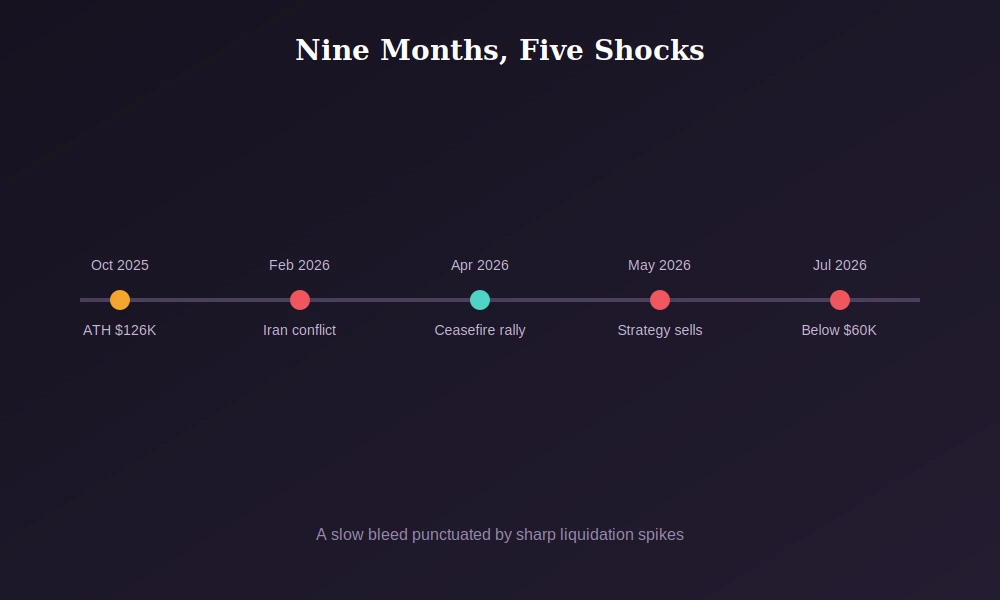
This wasn’t a single crash event, it was a slow bleed punctuated by sharp liquidation spikes over roughly nine months.
| Date | What happened |
| Oct 6, 2025 | Bitcoin hits its all-time high of $126,210 |
| Late Jan 2026 | Weak Microsoft earnings trigger a broader tech sell-off that spills into crypto |
| Feb 6, 2026 | Bitcoin drops 15% in a single session to near $60,000 |
| Feb 28, 2026 | US and Israeli strikes on Iran trigger $515M in liquidations within 24 hours |
| Apr 7, 2026 | A US-Iran ceasefire sends Bitcoin to $72,700; Strategy buys 34,164 BTC |
| Late May 2026 | The ceasefire fractures; ETFs post $2.8B in outflows over nine sessions |
| May 26-31, 2026 | Strategy sells BTC for the first time since 2022, spooking the market |
| Jun 3, 2026 | Mt. Gox moves $739M in BTC, reviving creditor-selling fears |
| Jul 1, 2026 | Bitcoin falls below the $60,000 psychological level |
Reason One, the Fed Rate Cut Reversal
Bitcoin’s 2025 rally was substantially fueled by expectations of falling interest rates. Trump’s announcement of a 15 percent global tariff in late February pushed inflation expectations high enough that rate-cut odds collapsed almost overnight, CME FedWatch data showed just a 6 percent probability of a March cut, down from over 20 percent a month earlier. Without the promise of cheaper money on the horizon, a meaningful chunk of the institutional capital that had piled into Bitcoin throughout 2025 started rotating back out toward safer assets.
Reason Two, the US-Iran Conflict and Oil Prices
On February 28, 2026, US and Israeli forces struck Iran, and Bitcoin dropped from $65,500 to $63,000 within an hour, with over $515 million in leveraged positions liquidated in 24 hours. The conflict has continued flaring on and off since, and each escalation has pushed oil prices higher, which feeds directly into inflation expectations and reinforces the same hawkish Fed narrative already weighing on risk assets. A brief ceasefire in April sent Bitcoin rallying back above $80,000, which shows just how tightly this crash has been tied to geopolitical headlines rather than anything happening inside the crypto market itself.
Reason Three, Bitcoin ETFs Flipped From Buyers to Sellers
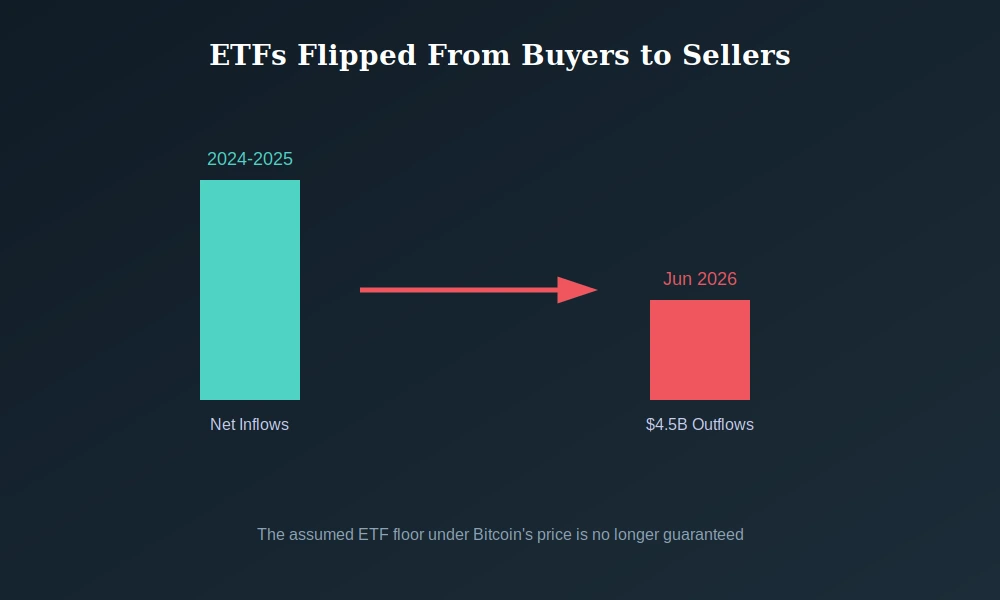
This is the structural shift most casual coverage undersells. Spot Bitcoin ETFs were the defining story of 2024 and 2025, a steady, reliable source of institutional buying that many investors treated as an implicit floor under the price. That assumption broke in 2026. US spot Bitcoin ETFs recorded roughly $4.5 billion in net outflows in June alone, following an earlier stretch in late May where outflows hit $2.8 billion across just nine trading sessions. ETF flows aren’t inherently bullish or bearish, they’re simply two-sided now, capable of accelerating a rally on the way up and deepening a drawdown on the way down, and 2026 is the year that second scenario played out at scale for the first time.
Reason Four, Strategy’s Shock First-Ever Bitcoin Sale
Michael Saylor’s Strategy built its entire public identity around never selling Bitcoin, and between late May and early June, the company sold 32 BTC for about $2.5 million, its first sale since December 2022. The dollar amount was tiny relative to Strategy’s overall holdings, but the symbolism landed hard, Bitcoin slipped below $72,000 within hours of the disclosure. When the market’s most vocal permabull sells anything at all, even a rounding error relative to their treasury, it tends to rattle confidence disproportionately to the actual size of the trade.
Reason Five, Mt. Gox’s Creditor Repayment Shadow
On June 3, 2026, the defunct Mt. Gox exchange moved 10,422 BTC, worth roughly $739 million, to a new wallet, reviving long-standing fears about creditor selling ahead of an October 2026 repayment deadline. Bitcoin flashed down to $65,372 intraday with $1.86 billion in liquidations within 24 hours. Whether or not those creditors actually dump their coins on the open market once repaid remains uncertain, but the market has repeatedly shown it would rather price in the worst case early than get caught flat-footed later.
This Bitcoin Crash Is Different, Institutional, Not Retail-Driven
Compare this to the 2022 cryptocurrency crash, which was driven by exchange collapses, a stablecoin depegging, and heavily leveraged retail speculators getting forced out in panic. Nothing comparable has happened in 2026. No major exchange has failed, no stablecoin has broken its peg, and corporate treasuries have largely kept holding rather than dumping. This decline has instead been driven by ETF redemptions, basis-trade unwinds, and portfolio rebalancing into AI and semiconductor stocks, with retail panic following the institutional selling rather than leading it. That distinction matters for how this cycle plays out, institutional capital tends to move on macro conviction rather than pure fear, which historically produces a slower, grindier decline instead of a single dramatic capitulation event.
Is This Just the Halving Cycle Playing Out on Schedule
There’s a genuinely compelling structural argument buried under the daily headlines. Bitcoin’s mining reward halves roughly every four years, and historically, each halving has been followed by a blow-off top about 12 to 18 months later, then a bear phase. The 2024 halving lines up almost exactly with this pattern, peaking in October 2025 before rolling into the 2026 downturn. Seen through that lens, this crash isn’t a shock at all, it’s the bear phase of a cycle that’s arrived close to on schedule. The counterargument is that spot ETF adoption has brought in larger, more patient institutional capital that could dampen the sharpness of future boom-and-bust swings over time, and the current roughly 52 percent drawdown, while painful, is still notably smaller than the 77 to 85 percent collapses seen in 2018 and 2022.
Key Support Levels Traders Are Watching Now
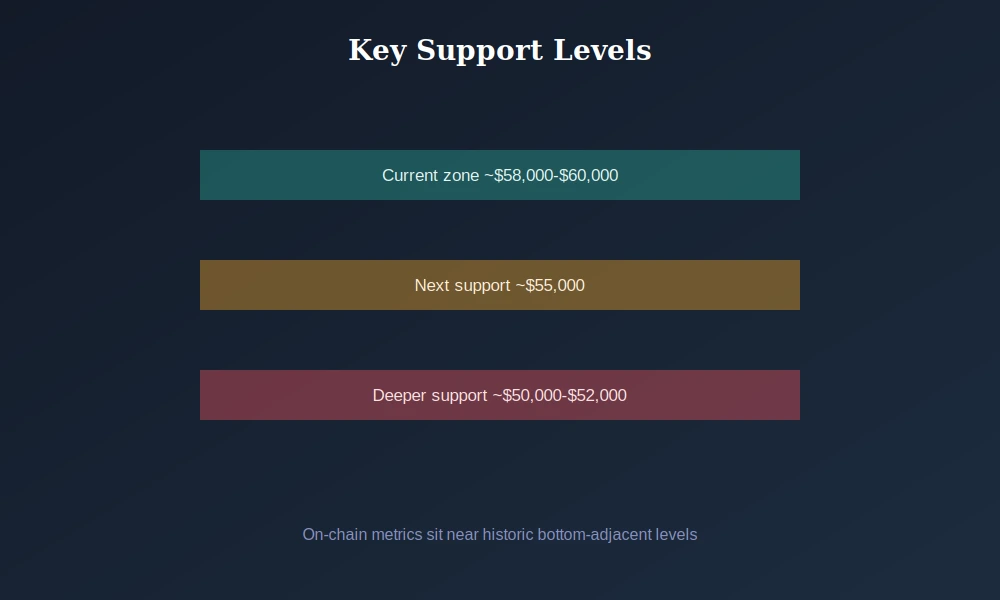
With Bitcoin trading in the high $50,000s to near $60,000, the market has three levels in focus. The immediate zone sits around $58,000 to $57,500, then $55,000 below that, with a deeper support zone near $50,000 to $52,000 if the selling continues. On the on-chain side, several metrics, including the MVRV Z-Score near 0.41 and Bitcoin testing its 200-week moving average, sit at levels historically associated with cycle bottoms, though none of these indicators guarantee a floor on their own. Extreme Fear readings below 15 on the Fear and Greed Index have marked medium-term accumulation zones in past cycles, but they’ve also persisted for weeks or months before any actual reversal, so patience matters more than trying to precisely time a bottom.
What Would It Take for Bitcoin to Actually Bottom
Three things would need to shift. ETF outflows would need to slow or reverse, removing the steady structural selling pressure that’s defined the past two months. The Federal Reserve would need to signal a credible path back toward rate cuts, which depends heavily on inflation data cooling from current levels. And either a genuine resolution to the US-Iran conflict or enough time passing for markets to stop pricing in escalation risk would need to happen, since that overhang has been driving outsized volatility every time it flares back up.
Should You Be Worried If You’re Holding Bitcoin
This isn’t financial advice, and nobody should make decisions about money they can’t afford to lose based on a single article. What’s genuinely worth sitting with is that this crash, unlike 2022, hasn’t been driven by fraud or structural failure inside crypto itself, it’s tracked broader macro and institutional forces that are, in principle, reversible once conditions shift. That’s meaningfully different from a collapse rooted in a broken business model or a depegged stablecoin. It still doesn’t guarantee any particular recovery timeline, and previous cycles suggest bottoming processes tend to be slow, ugly, and full of false starts rather than a clean V-shaped turn.
Frequently Asked Questions
Why is Bitcoin crashing in 2026?
Bitcoin is crashing due to a combination of the Federal Reserve reversing rate-cut expectations after new tariffs reignited inflation fears, an unresolved US-Iran conflict, Bitcoin ETFs flipping from net buyers to net sellers, Strategy’s first-ever Bitcoin sale, and renewed fears over Mt. Gox creditor repayments.
How much has Bitcoin dropped in 2026?
Bitcoin has fallen approximately 52 to 53% from its October 2025 all-time high of $126,210, trading in the high $50,000s to near $60,000 as of early July 2026, making it one of the longest sustained drawdowns in Bitcoin’s recent history.
Is the Bitcoin bull market over?
It’s genuinely unclear. This crash has been driven by macro and institutional forces rather than a crypto-specific failure, and its roughly 52% drawdown remains smaller than the 77 to 85% collapses seen in 2018 and 2022, though the decline has lasted longer than typical prior corrections.
What is Bitcoin’s next support level?
Traders are watching $58,000 to $57,500 as immediate support, with $55,000 below that and a deeper demand zone near $50,000 to $52,000 if selling continues. A confirmed break below these levels could trigger further liquidations.
Will Bitcoin recover in 2026?
Recovery likely depends on Bitcoin ETF outflows slowing, the Federal Reserve signaling credible rate cuts, and some resolution to US-Iran tensions. Analyst cycle models place a probable bottom around October 2026, though this remains speculative and unconfirmed.











Comments 1