


Every crypto Twitter thread this month has the same three words buried in it somewhere: “is this bottom.” Price stops falling for four days and suddenly everyone’s an on-chain analyst. Then it dips again and the same people go quiet. That whiplash is exactly why “bitcoin bottom” is worth answering properly instead of with a vibe.
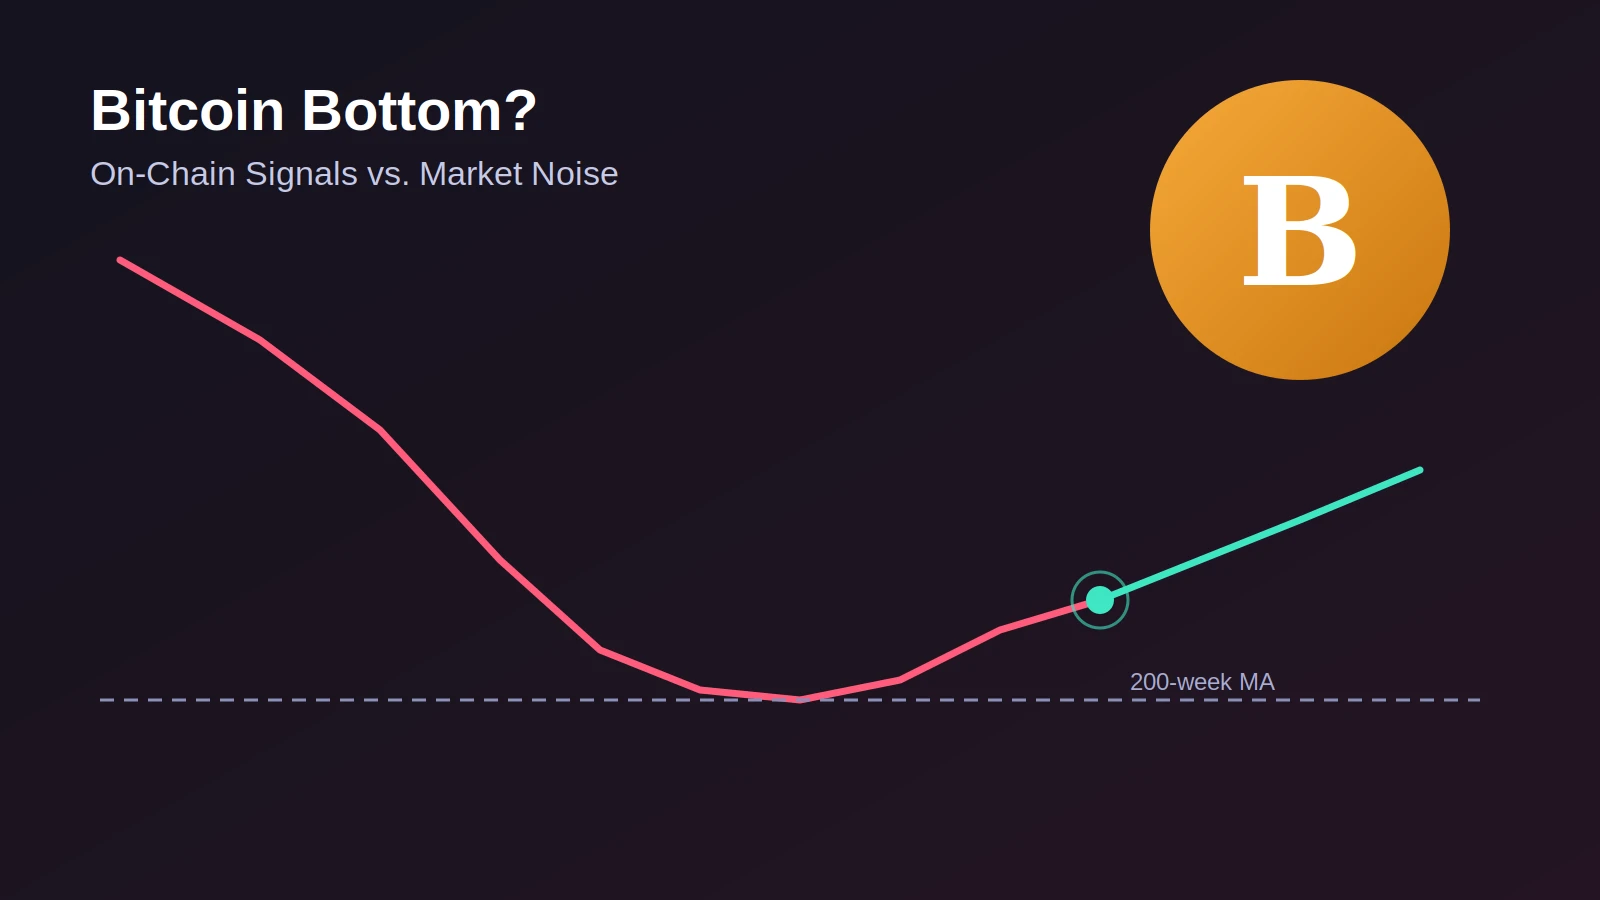
Quick answer: As of late July 2026, Bitcoin is trading around $64,000–$65,000 after briefly breaking below its 200-week moving average near $57,000–$58,000 in late June and early July, then reclaiming that level on the bounce. That break-and-reclaim pattern has preceded a bottom in every prior cycle, but on-chain researchers are calling this one “incomplete” rather than confirmed, since valuation metrics like the realized price and MVRV Z-Score haven’t fully reset the way they did in 2015, 2018, and 2022.
This isn’t a call to buy or sell anything. It’s a walk through what actually defines a Bitcoin bottom, which signals matter, which ones are noise, and an honest read on where things stand right now rather than a confident number pulled out of thin air.
Where Bitcoin Stands Right Now
Bitcoin peaked near $126,000 in October 2025. From there it slid in stages rather than crashing all at once: down through $100,000 in January, below $70,000 by February, and eventually touching a multi-month low around $57,950–$59,112 in late June and early July 2026 — a drawdown of roughly 52-54% from the top.
Since that low, price has recovered to the $64,000–$65,000 range, helped along by a pause in ETF outflows and a couple of days of net inflows in early July. That’s a real bounce, not a rounding error. But a bounce off a low isn’t the same thing as confirmation that the low is the final one for this cycle, and conflating the two is where a lot of casual price analysis goes wrong.
What Actually Defines a “Bitcoin Bottom”
People use the phrase loosely, so it’s worth being precise. A cycle bottom isn’t just “the lowest price of the year.” It’s the point where three things line up at once: price stops making new lows, on-chain valuation metrics show the market trading at or below the average cost basis of long-term holders, and sentiment is somewhere near maximum pessimism rather than cautious optimism.
A local low can happen anytime — a bad CPI print, a liquidation cascade, a scary headline. A cycle bottom is structural. It’s the level from which the next multi-year uptrend actually begins, and it’s usually only obvious in hindsight, which is exactly why so much energy goes into finding leading indicators instead of waiting for the history books.
The On-Chain Signals Analysts Actually Watch
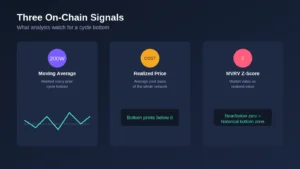
The 200-Week Moving Average
This is the one number that shows up in almost every serious Bitcoin bottom discussion. It’s a simple average of the last 200 weekly closes, and it has marked the floor of every major bear market since 2015. Bitcoin printed its first weekly close below this line in late June 2026, briefly trading beneath it before bouncing back above roughly $65,000.
Here’s the nuance that gets skipped: in 2015 and 2018, price dipped below the 200-week average only briefly before recovering. In 2022, following the FTX collapse, Bitcoin spent close to sixteen months below that line before finally reclaiming it. Whether 2026 behaves like the quick bounces or the extended 2022 stay depends heavily on whether anything resembling a systemic blowup — a major exchange failure, a stablecoin depeg — happens from here. So far, nothing like that has occurred this cycle, which is arguably the single most bullish structural difference versus 2022.
Realized Price
Realized price tracks the average cost basis of every coin on the network, based on the price at which it last moved. It’s a way of measuring what the market actually paid, on average, rather than what it’s willing to pay today. In every prior cycle, the final bottom printed below this level, not merely near it.
As of mid-2026, Bitcoin’s broader realized price sits somewhere in the mid-$50,000s, with long-term holders’ realized price closer to $49,700–$53,000. Price has approached this zone without conclusively breaking beneath it, which is one of the main reasons analysts are calling the current setup incomplete rather than done.
MVRV Z-Score
This metric compares market value to realized value and strips out some of the noise around short-term price swings. Historically, a reading near or below zero has coincided with major bottoms. Through June 2026, short-term holder MVRV dipped as low as roughly 0.82 during the worst of the selloff — a real capitulation signal — but the broader MVRV Z-Score has been bouncing rather than resetting fully below zero, which again points to “getting there” rather than “already there.”
Historical Bitcoin Bottoms: What 2015, 2018, and 2022 Actually Looked Like
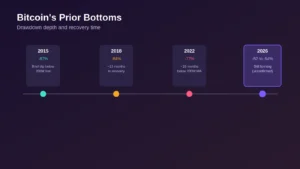
Context matters more than a single chart line, so here’s what the last three major bottoms actually involved:
- 2015: Bitcoin bottomed near $150–$200 after a roughly 87% drawdown from its 2013 peak. The bottom process took time and involved a slow grind rather than a single dramatic flush.
- 2018: BTC bottomed below $3,200 in December 2018 after an 84% fall from its ~$20,000 peak. The Mt. Gox and ICO-bubble unwind dragged the process out over about 13 months before the recovery began.
- 2022: Bitcoin fell from roughly $69,000 to under $16,000 — a 77% drawdown — accelerated by the Terra/Luna collapse and then the FTX bankruptcy in November 2022. This is the cycle where the 200-week moving average got breached for an extended stretch, precisely because a genuine systemic credit event kept forcing further selling.
Each of those bottoms shared two things: a drawdown north of 75-85% from the prior peak, and a specific credit-event or capitulation catalyst that marked the final leg down. The current cycle’s ~52-54% drawdown is meaningfully shallower than any of those three, which is either a sign Bitcoin has matured into a less volatile asset with a real institutional bid underneath it, or a sign the bottom simply hasn’t been tested as hard yet. Reasonable analysts disagree on which explanation is doing more of the work.
Has Bitcoin Bottomed in 2026? The Honest Read
Ruthlessly honest answer: probably not conclusively yet, based on the metrics that have called every prior bottom correctly.
The bull case: this cycle has no comparable systemic blowup to 2022’s FTX collapse, ETF outflows have paused and briefly reversed, Strategy and other corporate holders continue accumulating on dips rather than panic-selling, and the drawdown so far is shallower than any previous major cycle bottom. Sentiment readings have also reached genuine extreme-fear territory, which historically has been closer to a bottom than a top.
The bear case: the realized price and MVRV Z-Score haven’t actually reset the way they did at every confirmed prior bottom. Some respected on-chain researchers are explicitly framing this as a “reset through time” scenario — where the bottom forms gradually across a fourth-quarter window rather than through one final capitulation flush — which means more sideways chop, and possibly one more leg down, before the setup is genuinely complete.
Put simply: three of the four historical bottom conditions look present. The missing piece is a decisive test and reclaim of the 200-week moving average alongside a realized-price breach, and that hasn’t fully happened yet.
What Could Still Push Bitcoin Lower From Here
A few specific things would invalidate the “bottom is forming” thesis rather than confirm it: a hawkish surprise from the Federal Reserve that reignites dollar strength, a fresh wave of sustained spot ETF outflows rather than the brief stabilization seen in early July, a corporate treasury holder forced into distressed selling, or a geopolitical shock serious enough to trigger broad risk-off selling across every asset class at once, not just crypto. None of these are predictions — they’re simply the specific scenarios that would matter if they happened.
The Signals That Would Actually Confirm It
Rather than chasing a single price target, the more useful mental checklist looks like this: a weekly close back above the 200-week moving average that holds for several consecutive weeks, MVRV Z-Score resetting toward or below zero rather than merely dipping and bouncing, sustained (not one-week) positive ETF flows, and a Fear & Greed reading that starts climbing out of extreme fear without an immediate reversal back down. When multiple of these line up together rather than one at a time, that confluence has historically been a stronger signal than any individual metric on its own.
How Long Do Bitcoin Bottoms Usually Take to Play Out
This is the part that trips up people expecting a clean V-shaped reversal. 2015 and 2018’s below-trend periods were relatively brief. 2022’s stretch below the 200-week average lasted around sixteen months specifically because of the FTX-driven credit crunch. Absent a comparable event this cycle, a shorter bottoming window looks more likely than a repeat of 2022’s extended stay — but “shorter” in Bitcoin bottom terms can still mean months of sideways, nerve-wracking chop rather than a quick V-shaped bounce back to new highs.
Should You Buy Now or Wait for Confirmation?
This is a decision that depends entirely on time horizon and risk tolerance, not a one-size answer. Waiting for full confirmation across every metric means paying up once the picture is obvious — that’s the trade-off of certainty. Buying into unconfirmed weakness has historically produced the best long-term entries in every prior cycle, but it also means sitting through further drawdown if the “reset through time” scenario plays out and price grinds sideways or lower into Q4.
Dollar-cost averaging through the suspected bottoming window, rather than trying to time the exact low, is the approach most on-chain researchers themselves describe using — not because it’s exciting, but because nobody, including the analysts building these models, has reliably called an exact bottom in real time across multiple cycles. This isn’t financial advice, and your own risk tolerance matters more than any chart here.
Frequently Asked Questions
Is the Bitcoin bottom in for 2026?
Not conclusively as of late July 2026. Bitcoin has bounced off its 200-week moving average, but key valuation metrics like realized price and MVRV Z-Score haven’t fully reset the way they did at every previous confirmed cycle bottom.
What price is considered Bitcoin’s bottom?
There’s no single agreed number. On-chain models point to a range roughly between $50,000 and $58,000 based on the 200-week moving average and realized price levels, though the exact bottom is typically only clear in hindsight.
How do you know when Bitcoin has bottomed?
The strongest historical signal is a weekly close back above the 200-week moving average that holds for several weeks, combined with MVRV Z-Score resetting near zero and sustained positive ETF flows rather than a single good week.
How long did past Bitcoin bottoms last?
The 2015 and 2018 bottoms were relatively brief. The 2022 bottom, tied to the FTX collapse, lasted roughly sixteen months below the 200-week moving average before a confirmed recovery began.
Is this Bitcoin crash as bad as 2022?
No. The current roughly 52-54% drawdown from October 2025’s peak is meaningfully shallower than 2022’s 77% fall or 2018’s 84% fall, and there has been no comparable systemic credit event like FTX so far this cycle.
The Bottom Line
Nobody, including the analysts running the most sophisticated on-chain models, can hand you a confirmed date for the Bitcoin bottom. What’s actually useful is knowing which signals have worked before, watching for genuine confluence rather than one bullish headline, and being honest that “the bounce felt strong” isn’t the same as “the metrics have reset.” Right now, Bitcoin looks closer to a bottom than a top, but closer isn’t the same as arrived.
For the full breakdown of what actually triggered this drawdown in the first place, our Bitcoin crashing in 2026 piece covers the causes and timeline in detail. If you’re trying to understand how traditional finance is positioning around this cycle, our coverage of Wall Street going on-chain and BlackRock’s share price both touch on the institutional side of the same story.
For a neutral primer on how bull and bear market cycles are generally defined outside of crypto specifically, see the Wikipedia entry on market trends.